I would like to share some details about the tools that I’ve built to develop the Spark codecs.
When I started working on Spark I had no idea how much time and effort I would be investing on this project. I started with very few tools and helpers, with the goal of obtaining results quickly. While I was able to create a proof of concept in a few days, over time it became clear that I would need better tools in order to maintain that fast development pace.
The first tool I built was Spark Report, a command-line application that automates codec testing. It runs the codecs on diverse image sets, calculates error metrics, generates detailed reports, compares results with other codecs, and tracks performance over time. With Spark Report, I could confidently iterate on the codecs, knowing that any changes I made wouldn’t introduce regressions and would improve results across a wide range of images.
In addition to detecting regressions and doing comparative analysis against other codecs, I also needed a tool to dig deeper, understand the behavior of the codecs and the consequences of the changes. Something that I learned early is that you cannot trust error metrics too much, and that there’s no alternative to visual inspection, so I also built Spark View, a tool to view the output of the codecs.
There’s always been some tension between codec development, tools, and quality of life improvements, but in retrospect I think that every effort on better tools has paid off handsomely, and if anything I’d say I’ve delayed that work too much. In my defense, it was hard to justify the work without knowing the full scope of the project. Would I be working on Spark for a few months? Or a few years? Initially I did not know if it would be worth building a commercial product around it, but as things progressed, the scope of the project grew, adding more formats, more codecs, more platforms, and the depth of the codecs and the complexity of the optimizations increased.
Looking back, I wish I had prioritized tool development earlier, but hindsight always feels clearer in retrospect.
Development Process
Even though the Spark codecs are meant to run in the GPU, I initially develop them in the CPU. The CPU implementation is not intended to be used by customers; it is merely a playground to experiment with different algorithms and ideas, but it’s written in a way that makes it easy to translate the code to the equivalent compute shader.
The main advantage of doing this in the CPU is faster development. I can experiment much more quickly without having to worry about GPU resource constrains, bugs in the shader compilers, or differences between devices.
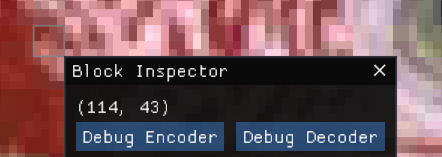
The code is also much easier to debug in the CPU. GPU debuggers have come a long way, but CPU debuggers are still much more powerful, robust, and easier to integrate into my tools. One of the Spark View features that I use most often is the ability to select a particular block and trigger a breakpoint when encoding or decoding the selected block:
The CPU code is not only much easier to debug, but also much easier to instrument in ways that allow me to gather statistics and tweak it’s execution at runtime.
When developing a new algorithm or refining an existing one, I often have different variants or variables that I can tweak to control execution. Surfacing these options to the public API of the codec, and then to the user interface, takes too much time. Most of these options are short-lived, enabling an experimental code path or keeping an old code path around for comparison.
Instead, I achieve this is using a global variable system with reflection. This is something that has been present in most of the games I’ve worked on in one form or another, but I think the way in which I’m using it is fairly innovative.
Global variables are declared in code as follows:
IC_VAR_BOOL(etc_exact_quantization, false)
IC_VAR_FLOAT(etc_planar_mode_threshold, 48)
These macros declare the global variables inside the var namespace and automatically register them in the variable system. Using the variables in code is straightforward:
if (lum_range < var::etc_planar_mode_threshold) { ... }
...
if (var::etc_exact_quantization) { ... }
else { ... }
By default, the variables take the values provided in the declaration, but those values can be overridden by different means. In final builds, the variables become constants, allowing the compiler to eliminate unused code branches for performance. However, this is not particularly important, as by that point most of the variables have been eliminated.
One way to customize the variables is by using simple config files like this:
etc_exact_quantization true
etc_planar_mode_luma_threshold 32
Spark View loads a config file at startup and constantly monitors it for changes. When the config file is updated, the current codec is re-run automatically. This provides immediate feedback and an intuitive way to exercise different code paths, test the effect of various values, and inspect the results visually.
Spark Report also loads a similar config file at startup, but when running a specific test it allows me to specify an additional config file that may override some of the values.
This allows me to quickly make changes to the codecs, visually verify the consequences of the change in Spark View, and then validate it across a larger set of images using Spark Report.
For example, I was recently developing a new ETC2 codec and my initial heuristic was similar to that of the QuickETC2 paper: using fixed luma threshold to select the best mode. I thought a better approach would be to try the planar more more aggressively, but only use that mode if the residual of the least squares solver was under a given threshold.
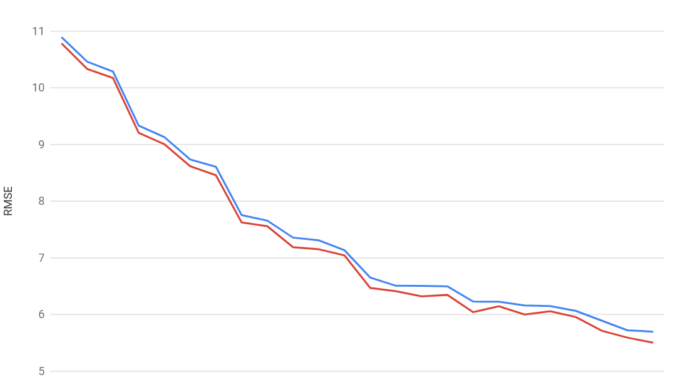
I could enable that new code path using the etc_planar_try_residual_error variable, and that allowed me to run tests with the variable on and off:
{ Encoder_Spark, Format_ETC2_RGB, 1, "etc_planar_try_residual_error false" },
{ Encoder_Spark, Format_ETC2_RGB, 1, "etc_planar_try_residual_error true" },
The results showed a small, but consistent improvement across all images:
Similarly, I could run the same tests using different residual thresholds to determine the ideal value. If any of the images behaved in an unexpected way, I would then use Spark View to investigate the behavior on that particular image.
Spark View
Spark View is not just an image viewer that applies the Spark codecs to the output. It supports practically every texture encoder I’m aware of. This is useful to compare my codecs against others and to understand the choices those codecs are make.
I ship Spark View with the Spark SDK, but in that build, I only include my own codecs to minimize third-party dependencies. For my development builds, I usually enable just a handful of codecs to speed up build times and keep the user interface uncluttered. Enabling or disabling codecs at compile time is very straightforward, and I often create custom builds of Spark View to share with customers. I can easily enable the codecs they use, allowing them to make side-by-side comparisons. In some cases, I have even integrated customers’ custom internal codecs into Spark View for more direct comparisons with Spark.
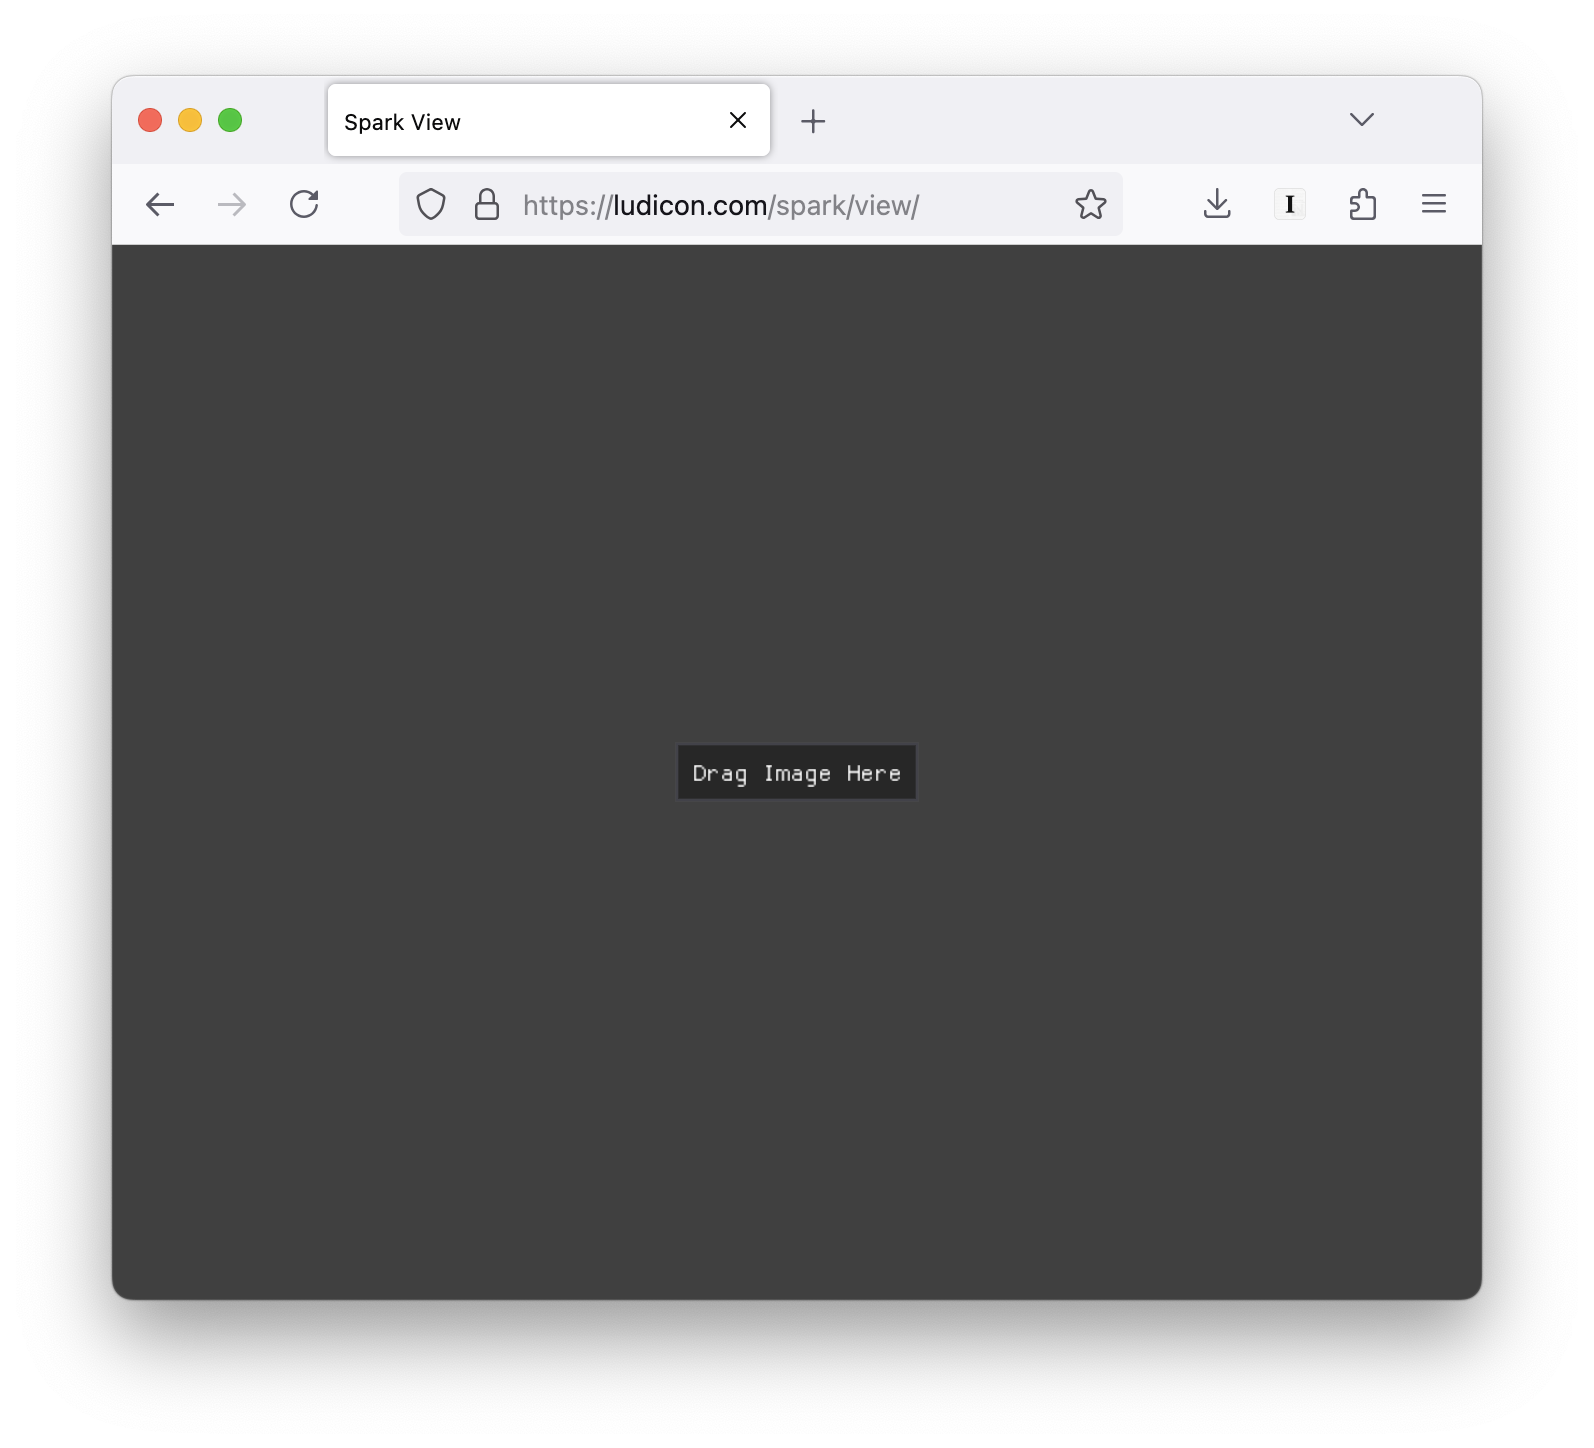
Recently, I created a wasm/emscripten build of Spark View so people can try it directly on the web:
Most of the advanced tools in Spark View are available only in my development builds. One of my favorite features is the block inspector, which I previewed earlier:
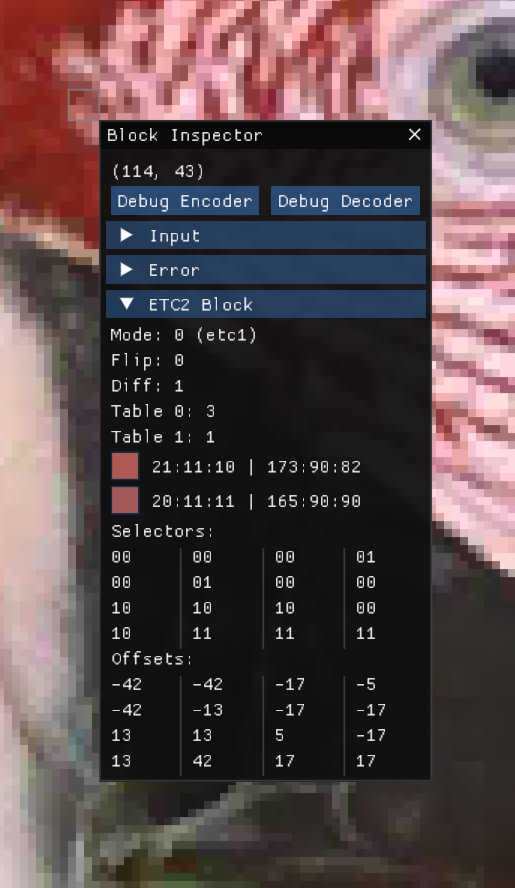
The inspector allows me to select a specific block of an image and inspect many of its properties. I can view the block’s color ranges and average color. I can examine the covariance matrix and its derived properties, such as the direction of the best-fit line and the magnitude of the eigenvalues. I can also review the block’s average error, the differences in individual texels, and the coding choices made by the encoder.
Nothing beats the integrated debugger functionality for understanding how the encoder arrives at its results. Unfortunately, this feature is not avilable when using a GPU codec. Instead, depending on the API backend, I provide the ability to capture GPU data using either PIX or RenderDoc and immediately opening it in the corresponding application. While useful, this process is less convenient than pausing a CPU debugger at the block being encoded. It involves navigating the debugger UI to locate the dispatch call, starting the shader debugger, and entering the thread ID corresponding to the selected block.
I am hopeful that RenderDoc’s Python API will allow me to automate this process entirely, though I have not implemented it yet.
Spark Report
Spark Report produces two forms of output: a CSV file for regression testing and an HTML report with charts, tables, and thumbnails that are easier to inspect visually. For generating the charts, I use the Google Charts API. Early on, I used to spend a lot of time copying numbers into Excel and generating charts manually, so having this process fully automated has been a huge time saver.
Like Spark View, Spark Report serves two purposes. One is the internal use I described earlier, but in addition to that the reports it generates are also a valuable marketing tool.
For example, I can create reports using textures provided by customers or other representative assets to showcase the performance of Spark codecs compared to common alternatives, or even against customers’ own internal codecs.
Here is an example report comparing the new ETC2 codec currently under development with other popular codecs that are publicly available:
https://ludicon.com/spark/report/etc2
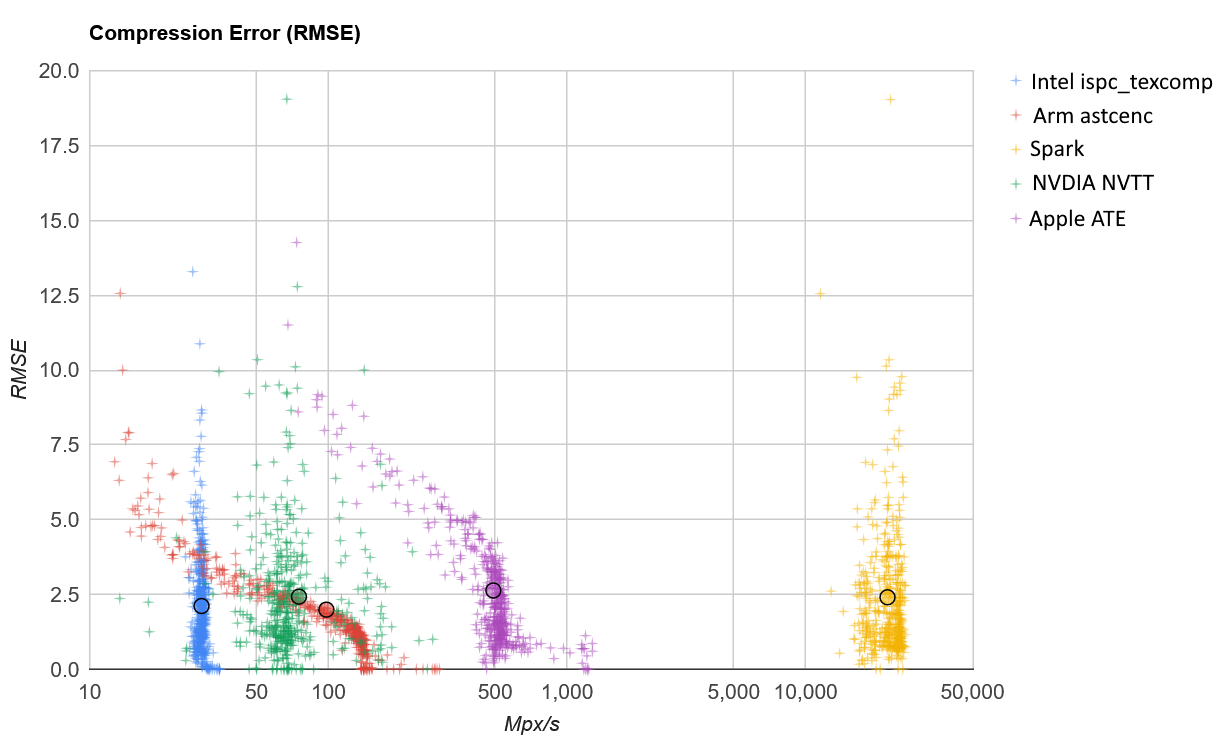
The use of the Google Charts API is extremely powerful and enables me to generate charts that I would not know how to create manually. For example, when measuring both distortion and throughput over a large set of images, I can produce charts like this, which provide a better insight into the performance of the different codecs:
That said, Google does not have a good track record maintaining useful services like this that do not bring any revenue, often shutting them down with little notice. So, I my find myself scrambling for alternatives or developing my own.
Other Tools
In addition to these tools, I have developed several smaller utilities. Some of the most notable are the Shader Processor, the Offline Compiler, and the Android Launcher.
Shader Processor
The Spark Shader Processor is a utility that preprocesses the Spark shader code to retarget it for any supported shading language, such as HLSL, GLSL, or Metal. The processor also strips comments and removes features that I do not want to redistribute to customers. While functional, the Shader Processor is not as sophisticated as I would like it to be. Ideally, I would like to be able to minimize and obfuscate the shader code of the codecs, but this has taken a back seat to more pressing priorities. Fortunately, I can always redistribute precompiled shaders when some obfuscation is needed.
Offline Compiler
The Offline Compiler takes these shaders and compiles them using all the shader compilers I support. This includes not just fxc, dxc, glslang, metalc, and various console-specific compilers, but also several cross-compilation pipelines. Here is a subset of the shader compiler pipelines I regularly test:
- hlsl + dxc:dxil
- hlsl + dxc:dxil + metal-shaderconverter
- hlsl + dxc:spirv
- hlsl + dxc:spirv + spirv-cross:metal + metalc
- hlsl + glslang + spirv-opt
- hlsl + glslang + spirv-opt + spirv-cross:metal + metalc
- glsl + glslang + spirv-opt
- hlsl + fxc
- glsl es + glslang
- metal + metalc
I’m also in the process of evaluating Slang and adding it to the offline compiler.
Doing all this only allows me to catch compiler errors and warnings. The process I use to check for correctness and performance is a bit more cumbersome.
To catch performance regressions early, I have integrated offline shader analyzers from all the mobile and console vendors I support, as well as Radeon’s GPU Analyzer (RGA) for PC. I parse the output of each analyzer to extract relevant metrics and generate a CSV file for each vendor and platform. Whenever the shaders change, I can easily compare the new output against the last known good version to identify any unexpected regressions.
The output produced by these tools is a lot of information. I support around 16 different texture formats, each with three different quality levels, using more than 10 compiler pipelines. To narrow it down, I filter specific shader subsets for each vendor. Currently, I rely on visual inspection of the diff output, but I hope to automate this further by producing summaries that are easier to interpret.
The metrics reported by the offline compilers are often not representative of actual performance on the device. Sometimes the ratio between ALU and Load/Store operations changes in ways that make it unclear whether the change is an improvement or a regression. Sometimes an increase in instruction count enables shortcuts that are taken most of the time, resulting in better performance despite the higher count. There are also cases where all the metrics indicate an improvement, but the shader runs slower on specific devices for reasons that are hard to understand!
Android Launcher
In practice, nothing beats testing the codecs on actual devices. This is especially true on Android, where performance is often unpredictable, and changes that seem harmless can result in significant regressions, pipeline compilation errors, or even crashes. For this reason, I have put special effort into testing on Android.
I maintain a small device farm with about 20 devices connected to a pair of USB hubs, and I also use the Spark Demo App to benchmark the devices.
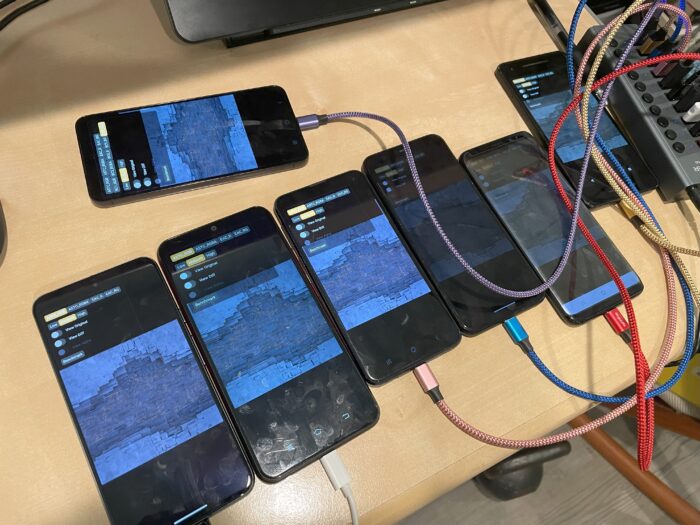
However, running these tests manually is time-consuming. To automate the process, I use a Python script that uses adb to enumerate the devices, launch a custom version of the demo app configured to start the desired benchmark automatically, and save the results to disk. The launcher monitors the file system for updates as the apps run. Once all results are written, it outputs a summary and saves them to a CSV file, which I use to check for correctness, quality and performance regressions.
Final Thoughts
As much progress as I have made in developing tools for Spark, there is still plenty of room for improvement. Better automation is one area I need to focus on, but several factors have held me back. Part of it comes down to development time and competing priorities, and to some extent, a lack of discipline. For example, it would have been useful to maintain a historical record of benchmarks. To do that, I would need to pick a specific set of images and stick to it without making changes over time, something I have not been disciplined enough to do.
Platform limitations also play a role. On Apple platforms, the lack of offline shader analyzers is frustrating. Having a Metal shader compiler that works on Windows is great, as it allows me to catch Metal errors regardless of the platform I am using, but a shader analyzer would be incredibly useful. I also have not spent much time automating testing on iOS, and I am not even sure it is possible to achieve the same level of automation I already have on Android.
Even practical concerns like space constraints have made automation harder. Testing on Android has been surprisingly easy compared to PC. I can set up a dozen mobile devices on my desk and run benchmarks on them without much trouble. In contrast, testing on PC requires physically swapping GPUs to test the code on different configurations, which is time-consuming, or having multiple PC setups, which takes up far more space.
Despite these challenges, improving automation is an area I plan to keep working on.
